


|
|
||
|
|
||
|
|
||
The S&P 500 Still Not Overvalued Taking Into Account Interest Rate Environment
Posted by Derek Tomczyk on Apr 17, 2015 - 12:00am
I just realized it's been almost a year since I've posted on this blog. I promise to try to post things far more often in the future. Here is an updated excess earnings yield analysis for 2015 with a slight twist in that this time I use real interest rates instead of nominal.
The S&P 500 Still Not Overvalued Taking Into Account Interest Rate Environment
While I try to stick to the facts throughout the rest of the web site the blog is the "unplugged" piece and is entirely my personal opinion which is very likely wrong and should definitely not be used for making investment decisions.
Comment/Like/ShareEarnings Yield On S&P 500 Points To Higher Levels By End Of 2014
Posted by Derek Tomczyk on Jun 9, 2014 - 12:00am
When interest rates are lower, the cost of capital is lower, therefore borrowing is cheaper and on the flip side lending money through the purchase of bonds yields a lower return. This should generaly support higher equity prices, but by how much? What is a reasonable valuation? Click below to find out.
Earnings Yield On S&P 500 Points To Higher Levels By End Of 2014
While I try to stick to the facts throughout the rest of the web site the blog is the "unplugged" piece and is entirely my personal opinion which is very likely wrong and should definitely not be used for making investment decisions.
Comment/Like/ShareThe Odds for a NASDAQ 100 rebound
Posted by Derek Tomczyk on Apr 16, 2014 - 12:00am
I recently took a look at the Biotech ETF IBB and concluded that while the odds are the investment is ready to rebound they're not great in the very short term. In addition it appears that while the investment positive return odds are good on a 2 month time-frame they carry above average risk of a large draw down in case of negative outcomes. I will now compare this result with a similar analysis for the Powershares NASDAQ 100 ETF (QQQ)
The histograms below have the probabilities in percentage on the left y-axis and ranges of prices/returns on the bottom x-axis. The dark green indicates historical probabilities without consideration for the current point in time while light green probabilities are calculated based on periods with similar characteristics to today.
First probabilities for May 17th
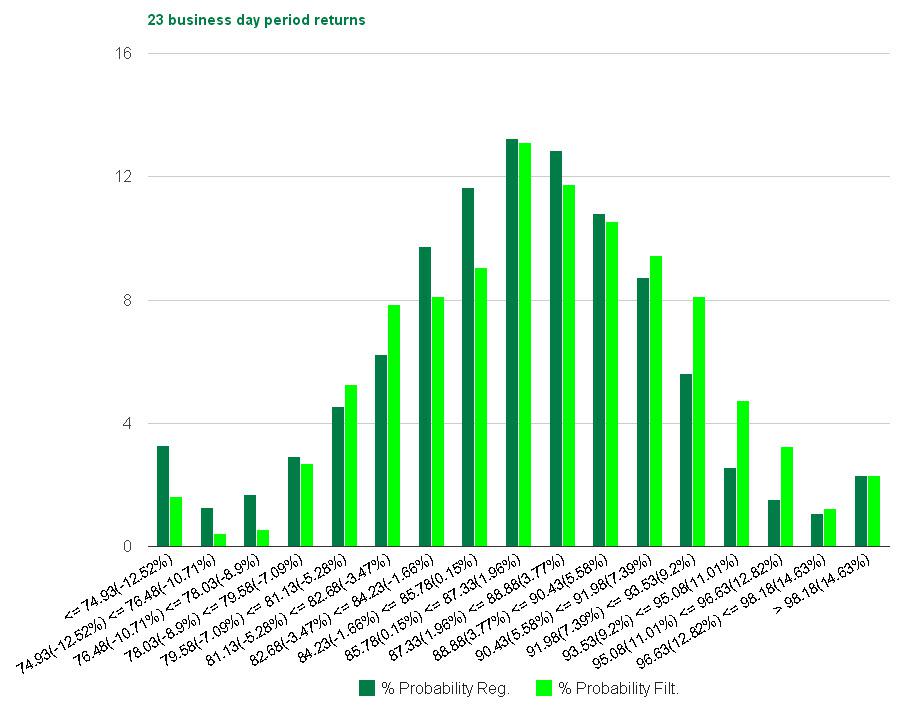
In contrast to the May 17th probability histogram for IBB the QQQ histogram appears to show a slight tilt to positive outcomes especially ones larger than normal. Notice the light green bars are far higher than the dark green bars for QQQ returns between 7% and 13%. In addition this distribution appears to have less than normal probabilities of negative returns.

The stats confirm the favourable expectations with an expected return more than twice the norm for May 17th. The average rally is slightly higher than normal while the average drop is lower than normal and the probability of a positive return is 65% versus 60%. The 1st standard deviation of returns is where the majority of the improved odds are which means the bet would be one that is expected to pay off a large percentage of the time. This looks like a very good risk/reward opportunity for any position exposed to long QQQ, even holding the ETF outright.
Next probabilities for June 21st
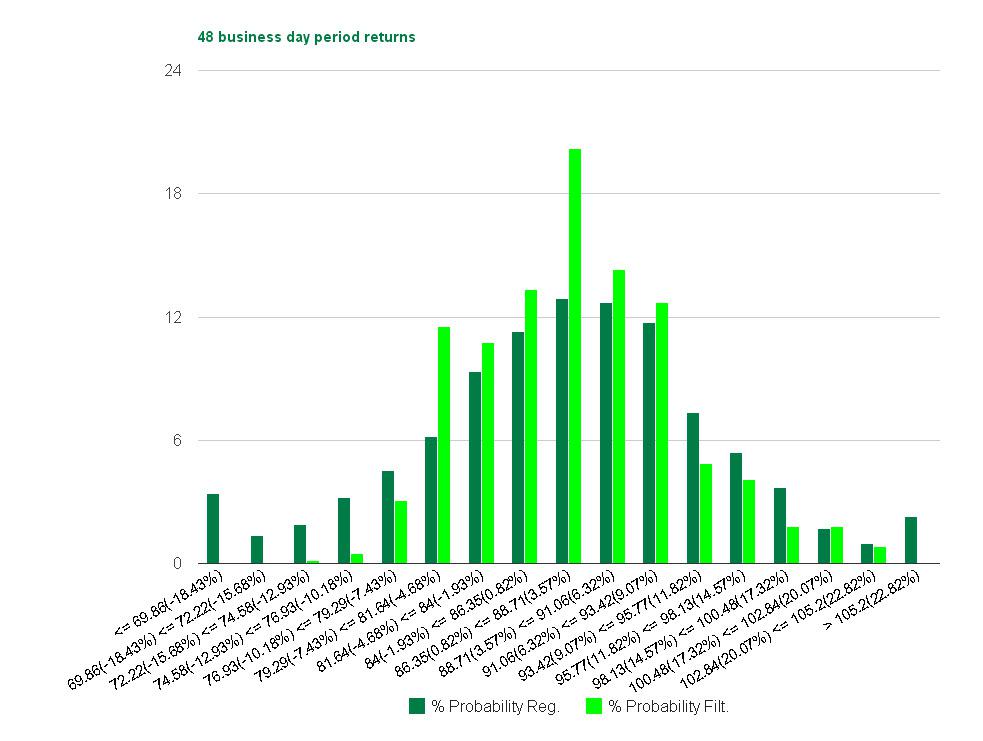
The probability curve for June 21st is far more narrow then normal. This does not tell us so much about the direction but rather indicates an expectation of a more narrow range of outcomes. The curve is titled to the positive side a bit, but mostly due to a reduced probability of very negative outcomes rather than an expectation of very positive outcomes.
The stats also tell us a similar story with the expected ROR for the period being larger than normal but not quite as extreme as for May 17th. The probability of a positive investment return is above normal, but less so, and the average rally is less than normal but so is the average drop.

This is a situation where an outright position in the ETF or a deep in the money option are better choices than out of the money option bets. The probability of a large loss on QQQ by June 21st, in direct contrast to IBB, is far below normal so exposing yourself to the risk is a better choice than paying a premium for protection. There is a also a larger than normal probability of a return up to 9% so a leveraged position may a good choice at this time. Therefore much better opportunities for call option positions out of the money lie in the May 17th option chain.
Click here to search for QQQ options that will generate a profit by May 17th given an average rally
While I try to stick to the facts throughout the rest of the web site the blog is the "unplugged" piece and is entirely my personal opinion which is very likely wrong and should definitely not be used for making investment decisions.
Comment/Like/ShareThe Sell Off in Biotech is Coming to an End
Posted by Derek Tomczyk on Apr 13, 2014 - 12:00am
The biotech ETF IBB has taken a beating over the past couple of months with a total decline of 20% since Feb 25th. It’s very tempting to look at this as a buying opportunity so let’s see what the historical probabilities tell us.
The histograms below have the probabilities in percentage on the left y-axis and ranges of prices/returns on the bottom x-axis. The dark green indicates historical probabilities without consideration for the current point in time while light green probabilities are calculated based on periods with similar characteristics to today.
First probabilities for May 17th
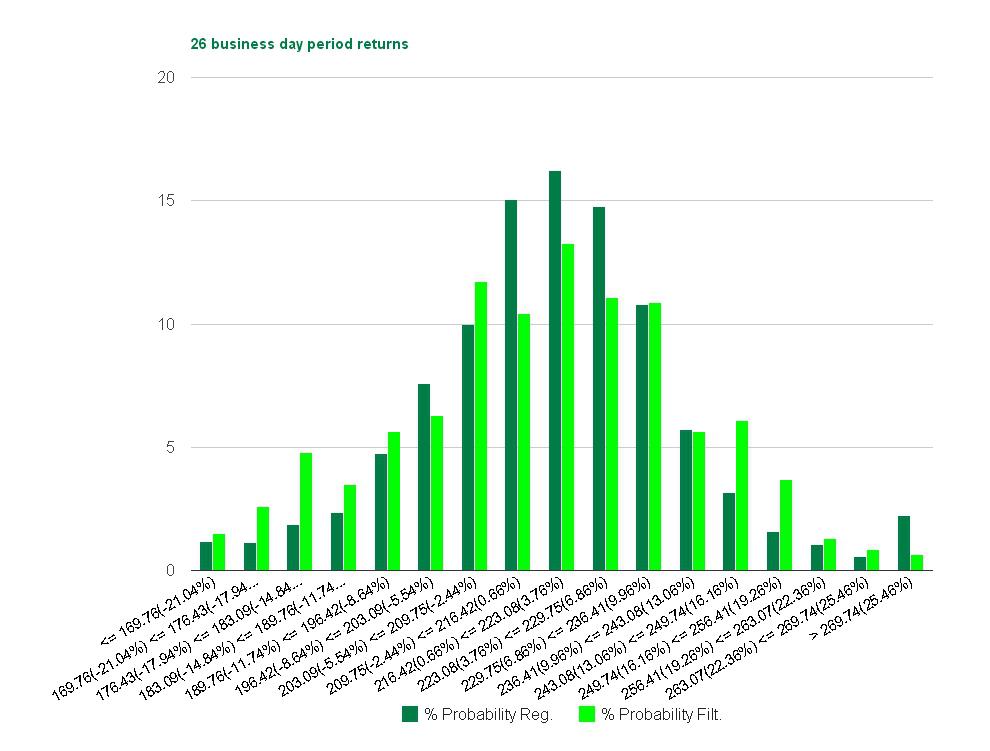
There is a slight tilt to extreme outcomes but if anything the probabilities are skewed slightly negative as compared to normal. The stats tell us a similar story with the range of outcomes showing a negative slant

While the expected return is positive it is less so than normally and the probability of a positive investment period is lower than normal. It does not appear IBB offers a good risk/reward scenario at this time, at least not with the holding period ending on May 17th.
Next probabilities for June 21st
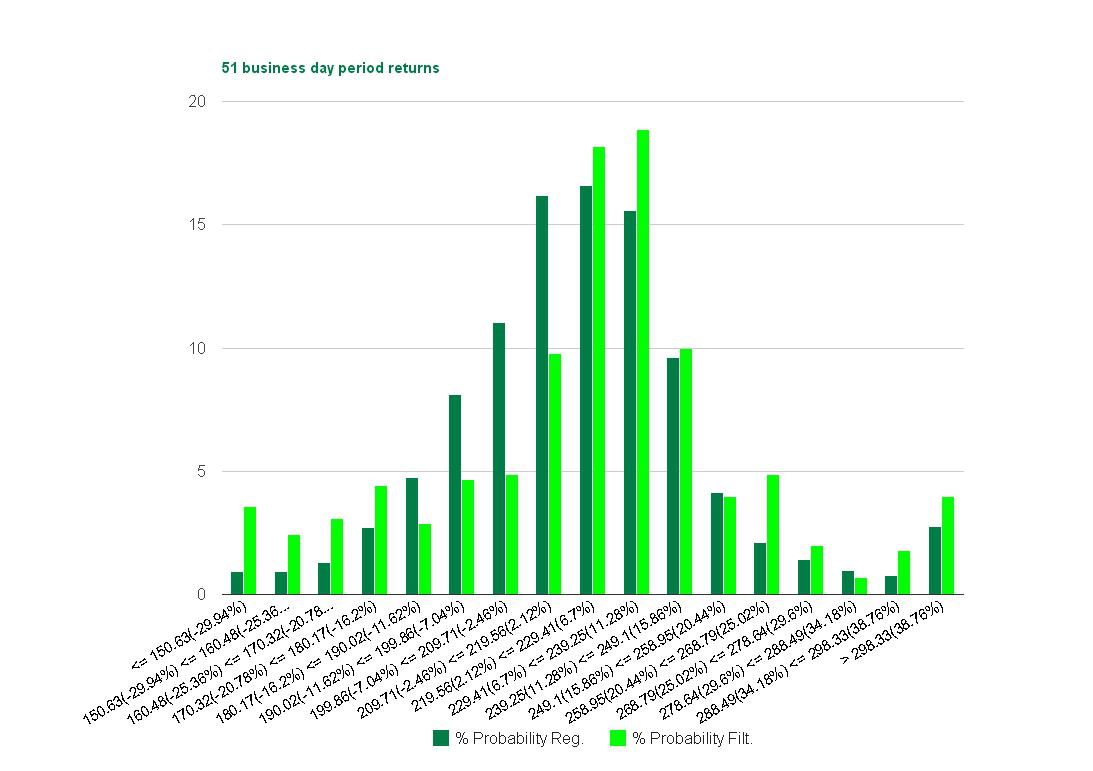
The probabilities for June 21st are decidedly shifted to the positive. There is definitely a higher than normal probability for positive outcomes, however, there is also a more than usual probability of extreme negative outcomes.
The stats also tell us that the odds are tilted in the favor of IBB for a holding period ending on June 21st. The probability of a positive investment return is above normal and the average rally is above normal. However, the risk of taking an outright IBB position is also above normal with an average drop of 15.1% in case of a negative return.

The option contracts on IBB expiring on Jun 21st are the perfect way to play this situation and while the premiums have increased they have not increased enough across all strikes to reduce the expected returns below acceptable levels. However, given the murky picture for May 17th a little bit of patience may be a good idea prior to initiating a position.
Click here to search for IBB options that will generate a profit by June 21st given an average rally
While I try to stick to the facts throughout the rest of the web site the blog is the "unplugged" piece and is entirely my personal opinion which is very likely wrong and should definitely not be used for making investment decisions.
Comment/Like/ShareThe Odds 2014 Will Be Just As Good As 2013
Posted by Derek Tomczyk on Jan 15, 2014 - 12:00am
It's been a while since I've posted anything but with a great 2013 coming to an end everyone is wondering what is possible in 2014. This article attempts to answer the question of whether 2013 returns have any bearing on the odds for 2014 returns.
The Odds 2014 Will Be Just As Good As 2013
While I try to stick to the facts throughout the rest of the web site the blog is the "unplugged" piece and is entirely my personal opinion which is very likely wrong and should definitely not be used for making investment decisions.
Comment/Like/ShareCumulative Performance Graph
Posted by Derek Tomczyk on Oct 17, 2013 - 8:33pm
The home page has been updated with a cumulative performance graph. The graph shows the cumulative rate of return achieved by the Optionize portfolio since inception. There are a number of benchmarks that can be selected and graphed against the portfolio performance. In addition a red line shows the Value Added and is graphed against the right axis. It shows the cumulative benefit achieved by the Optionize portfolio against the chosen benchmark.
While I try to stick to the facts throughout the rest of the web site the blog is the "unplugged" piece and is entirely my personal opinion which is very likely wrong and should definitely not be used for making investment decisions.
Comment/Like/ShareHow To Protect Yourself From Market Corrections – Or Worse
Posted by Derek Tomczyk on May 27, 2013 - 10:53pm
We are now in the heading into the 7th month of a major rally in US equities. I've discussed at length why I think the US economy will continue to outperform in some of my previous articles. However, investors are now starting to ask questions about the rallies sustainability. There are in fact good reasons to believe that we've gone too far too fast. If we were to continue rising at this pace the S&P500 would end the year approx. 35% up from the beginning of the year. I just don't think the fundamentals or sentiment support this.
Another reason to be worried is the fact that the rest of the world has not joined into this US rally. I do believe that the US still has the strongest and best diversified economy in the world but no country is an island. The austerity measures implemented thus far this year by the US government are also unexpected and troubling. The full effect of the increase in payroll taxes and sequestration spending cuts is yet to be felt and the impact is likely to be negative.
All this combined with the seasonality effect (September One Of The Best Months To Invest In The S&P500) appears to be creating the perfect storm environment for US stock market indices in Q2 and early Q3.
In the end though, for most long-term investors, the issue of a possible market correction is a minor one compared to the possibility of a full out reversal of trend. While personally I think the overall bull market has a long way to go there is no such thing as a sure thing in investing. I consciously keep in mind the small probability that this will be the third top of the new century before we head lower. However, while I admit the probability of this happening, I do not worry about it, because if it does, I will come out more than alright.
How is it possible to keep a long term bullish bias, capture virtually the entire upside of any rally, while at the same time profit from any market dislocations?
The key is efficient use of portfolio protection. The way I construct my portfolio I always have some absolute downside protection but in times like these a little extra insurance may be well worth your money.
I have recently purchased out-of-the-money put options on a couple of holdings in my portfolio that have done the best year-to-date (IBB,SPY). What may be surprising is that I did not purchase the exact amount of contracts to offset my exposure. The use of option contracts with their greeks, black-scholes model and implied volatilities can be really intimidating to most investors who are not used to them. Luckily, there is a simpler, more intuitive way to determine where to buy and it's called scenario analysis.
Choosing your time horizon
The first thing to consider is when you think the correction is most likely to take place. You would then choose the expiry date closest to butafter you expect the move to complete. You could do all kinds of sensitivity analysis but the answer is always the same and intuitive. The best time period to buy is the one that matches your expected time horizon most closely. For example, if I believe that whatever correction takes place will likely complete by May 18th 2013 I would buy my contracts with that expiry date.
Sizing your bet
The second thing to consider is how much you can afford to spend on protection based on your portfolio size. The time horizon chosen above may be wrong, you may have to re-establish your protection at a later date, and you should make sure this does not destroy your overall portfolio performance. Also, if the market rallies you should still come out ahead at the end of the time period. I would suggest no more than 1% of your entire portfolio spent on insurance (preferably less).
Calculating the payoffs
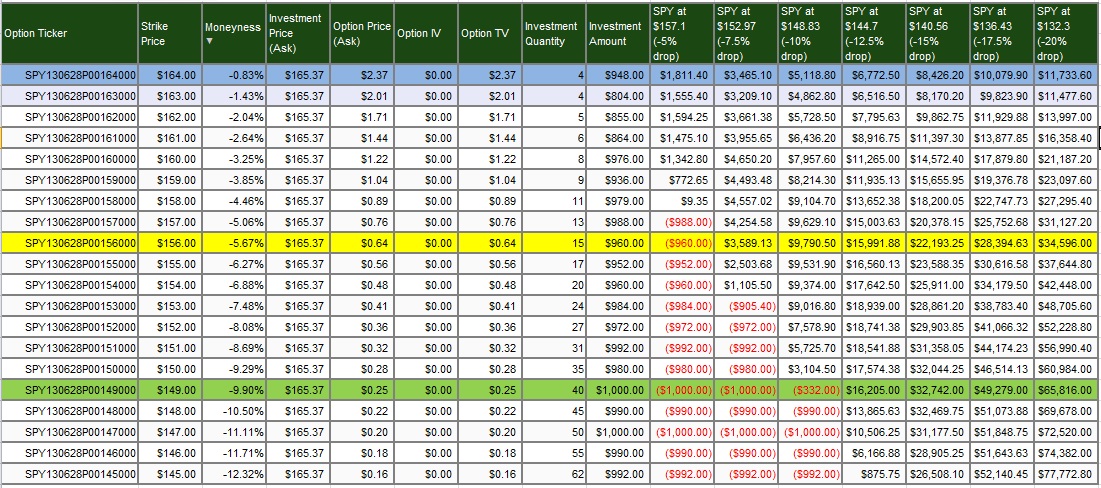
The next thing to consider is how far the market would have to fall by the expiry date for the insurance to payoff and to offset any losses on your holdings. For example the following is a chart of possible payoffs for a $1000 bet in the case of a SPY drop of various magnitudes (including expected SPY prices for those drops) completing by June 28th 2013.
Establishing probabilities
The last thing to do is to decide what the probabilities are for various magnitude drops for the security for which the insurance is being bought. There are many ways at arriving at those probabilities from looking at historical data to analyzing technical, fundamentals or even going with hunches. The choice can be as easy as choosing the most probable drop magnitude and choosing the largest payoff or as complicated as assigning different probabilities to different outcomes and multiplying the expected payoffs by those probabilities.
In the above screenshot I use the simple method of looking for the highest payoff for a given drop. In the case of an expected 5% drop completing by June 28th 2013 the SPY put option highlighted in blue with a strike price of 164 is the best choice. In the case of a 10% drop it would be the yellow highlighted option with a strike price of 156, while if the market collapses 15% the best choice will be the 149 strike highlighted in green.
What it all means
Lastly, you must consider what the dollar loss in your actual holdings would be given the simulated drops discussed above and compare that amount to the expected payoffs. Will the insurance payout fully cover your loss? And if not, is the coverage acceptable? Perhaps the payout will be larger than your expected loss in which case you will actually turn a profit.
In general it does not pay to protect against small loses because the insurance is too expensive. In addition when the market is already showing weakness and the implied volatility spikes it is generally too late to buy insurance at a reasonable price. The best time to buy insurance is when the market appears to have completed a large move and has been side-ways trending for a while. The S&P 500 today (May.24) has already started showing some weakness but protection is not yet expensive. You may want to consider adding protection now or waiting to see if the market starts to trade side ways over the next week or two.
This protection calculator can help you find the right option contracts to protect your investments.
While I try to stick to the facts throughout the rest of the web site the blog is the "unplugged" piece and is entirely my personal opinion which is very likely wrong and should definitely not be used for making investment decisions.
Comment/Like/ShareExciting new website updates!
Posted by Derek Tomczyk on May 7, 2013 - 6:28pm
Today we released a large number of changes to the website hopefuly making it more useful to investors. The following are the changes:
More frequent visitors may have noticed that some of the changes were already promoted last week. Please let us know what you think!
While I try to stick to the facts throughout the rest of the web site the blog is the "unplugged" piece and is entirely my personal opinion which is very likely wrong and should definitely not be used for making investment decisions.
Comment/Like/ShareNew calculators, put option support and HTML5 revamp!
Posted by Derek Tomczyk on Apr 11, 2013 - 9:01pm
The website just got a nice shiny HTML5 face-lift. The search for option contracts was completely revamped with a scenario narrative approach that we hope will be more intuitive to use. There are 3 basic scenarios that cover the most basic strategies of buying in-the-money, buying out-of-the-money and selling covered. If you have ideas for other calculators please email us and let us know. We love to hear suggestions!
Notice you can now search for both call and put options in all the calculators.
Lastly a yield curve page was added to show more than just the SPY yield curve featured on the home page. The SPY curve has proven to be an excellent forward looking indicator so hopefuly the others will be useful as well.
Dive right into the new calculators here.
While I try to stick to the facts throughout the rest of the web site the blog is the "unplugged" piece and is entirely my personal opinion which is very likely wrong and should definitely not be used for making investment decisions.
Comment/Like/ShareThe Real Price Of Gold
Posted by Derek Tomczyk on Feb 20, 2013 - 12:00am
This article attempts to find a way to value gold and then in turn compare this value to current gold prices.
While I try to stick to the facts throughout the rest of the web site the blog is the "unplugged" piece and is entirely my personal opinion which is very likely wrong and should definitely not be used for making investment decisions.
Comment/Like/ShareThe S&P 500 Still Not Overvalued Taking Into Account Interest Rate Environment
What we see is that outside of the depths of the 2008 financial crisis, the S&P 500 is still the cheapest it has been since around 1988. What is also evident is that the bull market that followed 1988 drove stock valuations to extremely overvalued levels but did not actually end until 2001.
read more ...
Earnings Yield On S&P 500 Points To Higher Levels By End Of 2014
In a lower interest rate environment the required return on capital on equity investments should be lower than would otherwise be the case. The longer this environment is expected to persist the lower the required rate of return on perpetuities such as equities would logically be.
read more ...
The Odds for a NASDAQ 100 rebound
The probability of a large loss on QQQ by June 21st, in direct contrast to IBB, is far below normal so exposing yourself to the risk is a better choice than paying a premium for protection. There is a also a larger than normal probability of a return up to 9% so a leveraged position may a good choice at this time. Therefore much better opportunities for a call option positions out of the money lie in the May 17th option chain.
read more ...
The Sell Off in Biotech is Coming to an End
The stats also tell us that the odds are tilted in the favor of IBB for a holding period ending on June 21st. The probability of a positive investment return is above normal and the average rally is above normal. However, the risk of taking an outright IBB position is also above normal with an average drop of 15.1% in case of a negative return.
read more ...
The Odds 2014 Will Be Just As Good As 2013
After a great year for the S&P 500 (SPY) in 2013, it's natural to wonder whether that type of pace can be maintained going forward into next year.
read more ...
The home page has been updated with a cumulative performance graph.
read more ...
How To Protect Yourself From Market Corrections – Or Worse
While personally I think the overall bull market has a long way to go there is no such thing as a sure thing in investing. I consciously keep in mind the small probability that this will be the third top of the new century before we head lower. However, while I admit the probability of this happening, I do not worry about it, because if it does, I will come out more than alright.
read more ...
New calculators, put option support and HTML5 revamp!
The website just got a nice shiny HTML5 face-lift. New calculators were added. Put option support was implemented and a yield curve page is now also available.
read more ...
The best way to think about gold price is to think in terms of exchange rates with gold being just another currency. The "Purchasing Power Parity" theory tells us that if the nominal price level increases in one currency (assuming no price level change in the other currency) then the exchange must deteriorate in favor of the other currency by the same percentage. In other words, the real exchange rate should always be static.
read more ...
Copyright © 2010-2021 Optionize Inc. All rights Reserved.
The information contained on this website is for information purposes only. Optionize Inc. is not responsible for the accuracy or timelines of any of the information. Please verify all prices with your broker prior to trading.